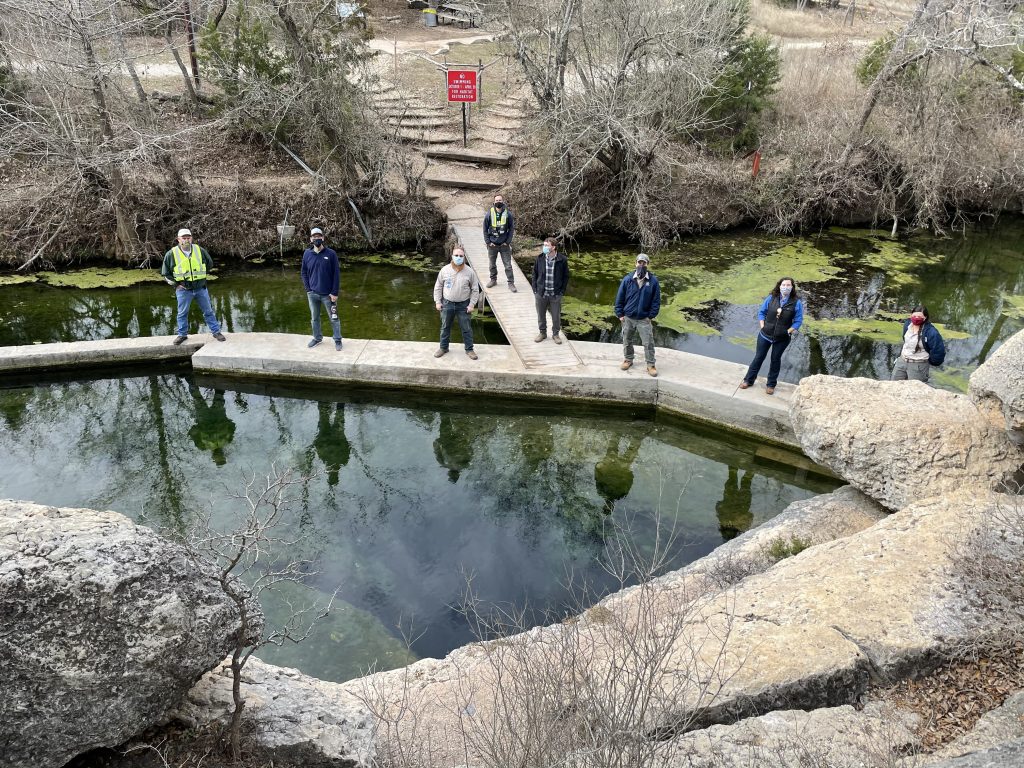
The WVWA would like to applaud all the agencies involved in flow monitoring at Jacob’s Well. As flow has declined and management decisions leverage these critical measurements, staff have been busy coordinating to ensure that the data are as accurate as possible. Jacob’s Well’s gauge is an incredible example of collaboration from Federal to local levels.
The U.S. Geological Survey (USGS) has increased site visits to verify flow reporting with manual measurements. Guadalupe Blanco River Authority funds the gauge with help from the USGS Coop program to manage and protect surface water flows. Hays County manages the Jacob’s Well Natural Area. The Hays Trinity Groundwater Conservation District (GCD) uses a 10-day average flow as drought triggers to help protect groundwater supplies and spring flow within the Jacob’s Well Groundwater Management Zone. The Edwards Aquifer Authority (EAA) provides technical assistance for groundwater-surface water interactions, because Trinity Aquifer springs provide important baseflow for Edwards Aquifer recharge creeks and rivers.
While the Jacob’s Well Groundwater Management Zone was just established in March 2020, groundwater levels and spring flow have warranted coordinated conservation for a long time. In 2010, the Cypress Creek Project Watershed Characterization Report found that below 4 cubic feet per second (cfs), dissolved oxygen and aquatic habitat is impacted. The continuous flow record shows flow reached a daily average of zero in 2009, 2011, and 2013. As a tool to coordinate water use during drought, the Hays Trinity GCD established 10-day average thresholds to guide water conservation.
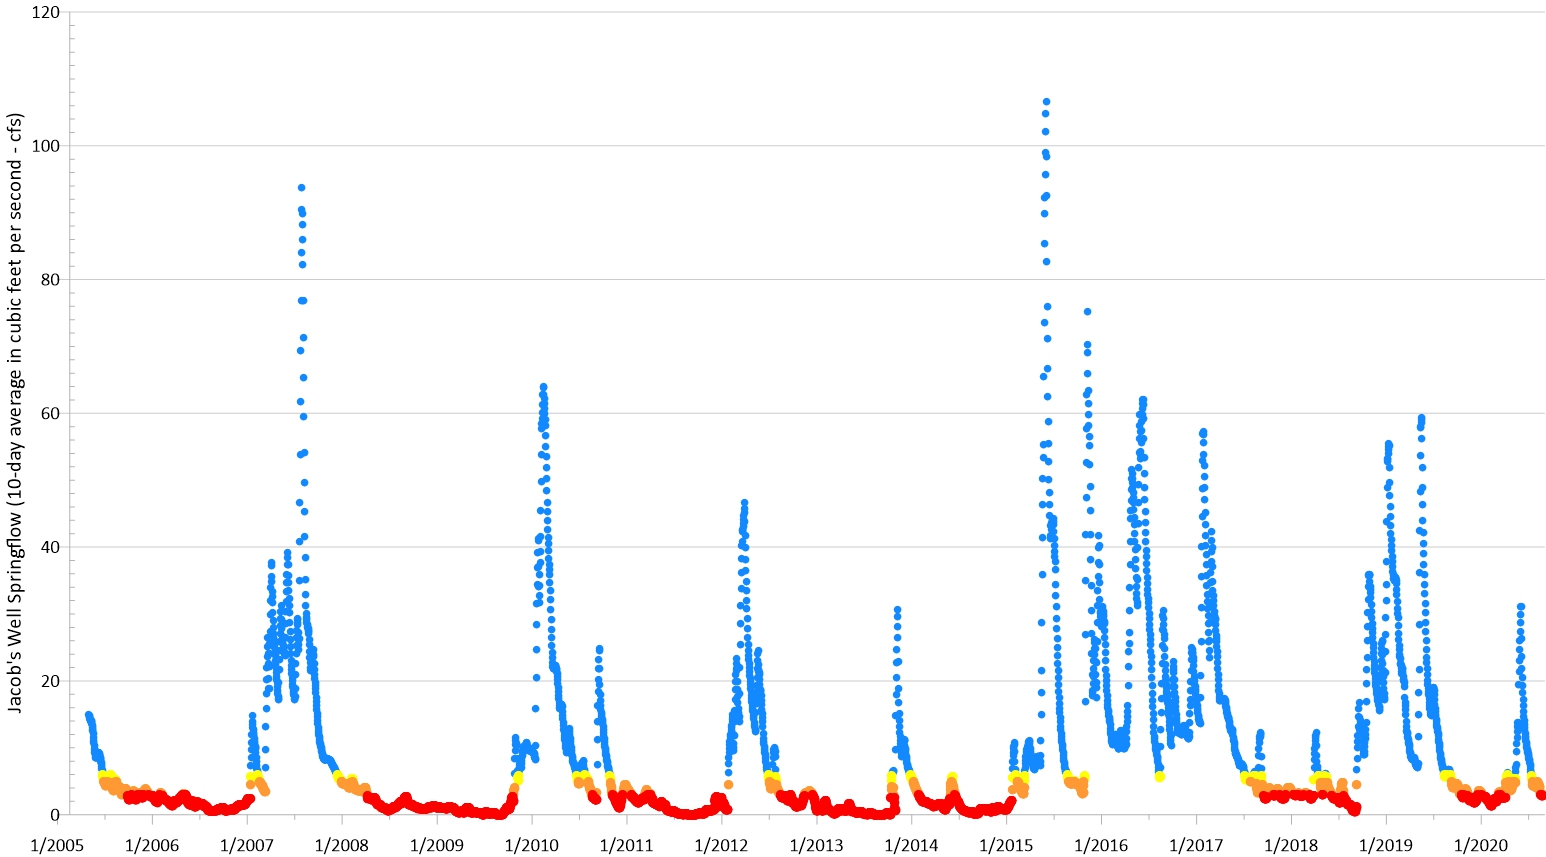
| Graph color | Flow Threshold | Explanation |
| Blue | Above 6 cfs | No Drought condition |
| Yellow | 6 cfs (10-day average) | 10% Pumpage Curtailment Level* |
| Orange | 5 cfs (10-day average) | 20% Pumpage Curtailment Level* |
| – | 4 cfs (or below) | Dissolved oxygen reduced and aquatic habitat impacted** |
| Red | 3 cfs (10-day average) | 30% Pumpage Curtailment Level* |
* Curtailment levels established through Hays Trinity GCD Rule 15
** Dissolved oxygen study documented in the Cypress Creek Characterization Study
Useful Links:
- USGS Real-time gauge at Jacob’s Well
- WVWA Water Monitoring page – monthly hydro report and links to selected monitoring sites
- Evaluation for the Development of a Jacob’s Well Groundwater Management Zone in Hays County, Texas
- Cypress Creek Project Watershed Characterization Report
- Hays Trinity GCD Jacob’s Well Groundwater Management Zone page